World records as measures of senescence
For those who prefer video, this case study is described in the April 19th lecture of our Spring 2017 course.
No one is immune to calls of bullshit. In this case study, we'll take a look at an example from my own book, Bergstrom and Dugatkin (2016) Evolution.
In a section of this textbook that deals with the evolution of senescence, I note that not only does mortality increase and fertility decrease with age , but individuals undergo decline in physical performance with age as well. In an attempt to illustrate this point, I provide graphs of world record performances in six track and field events, for different age groups. In these visualizations, reproduced below, performance is scaled relative to the world record for any age. In track events, performance is quantified as average speed; in field events, performance is quantified as distance or height.
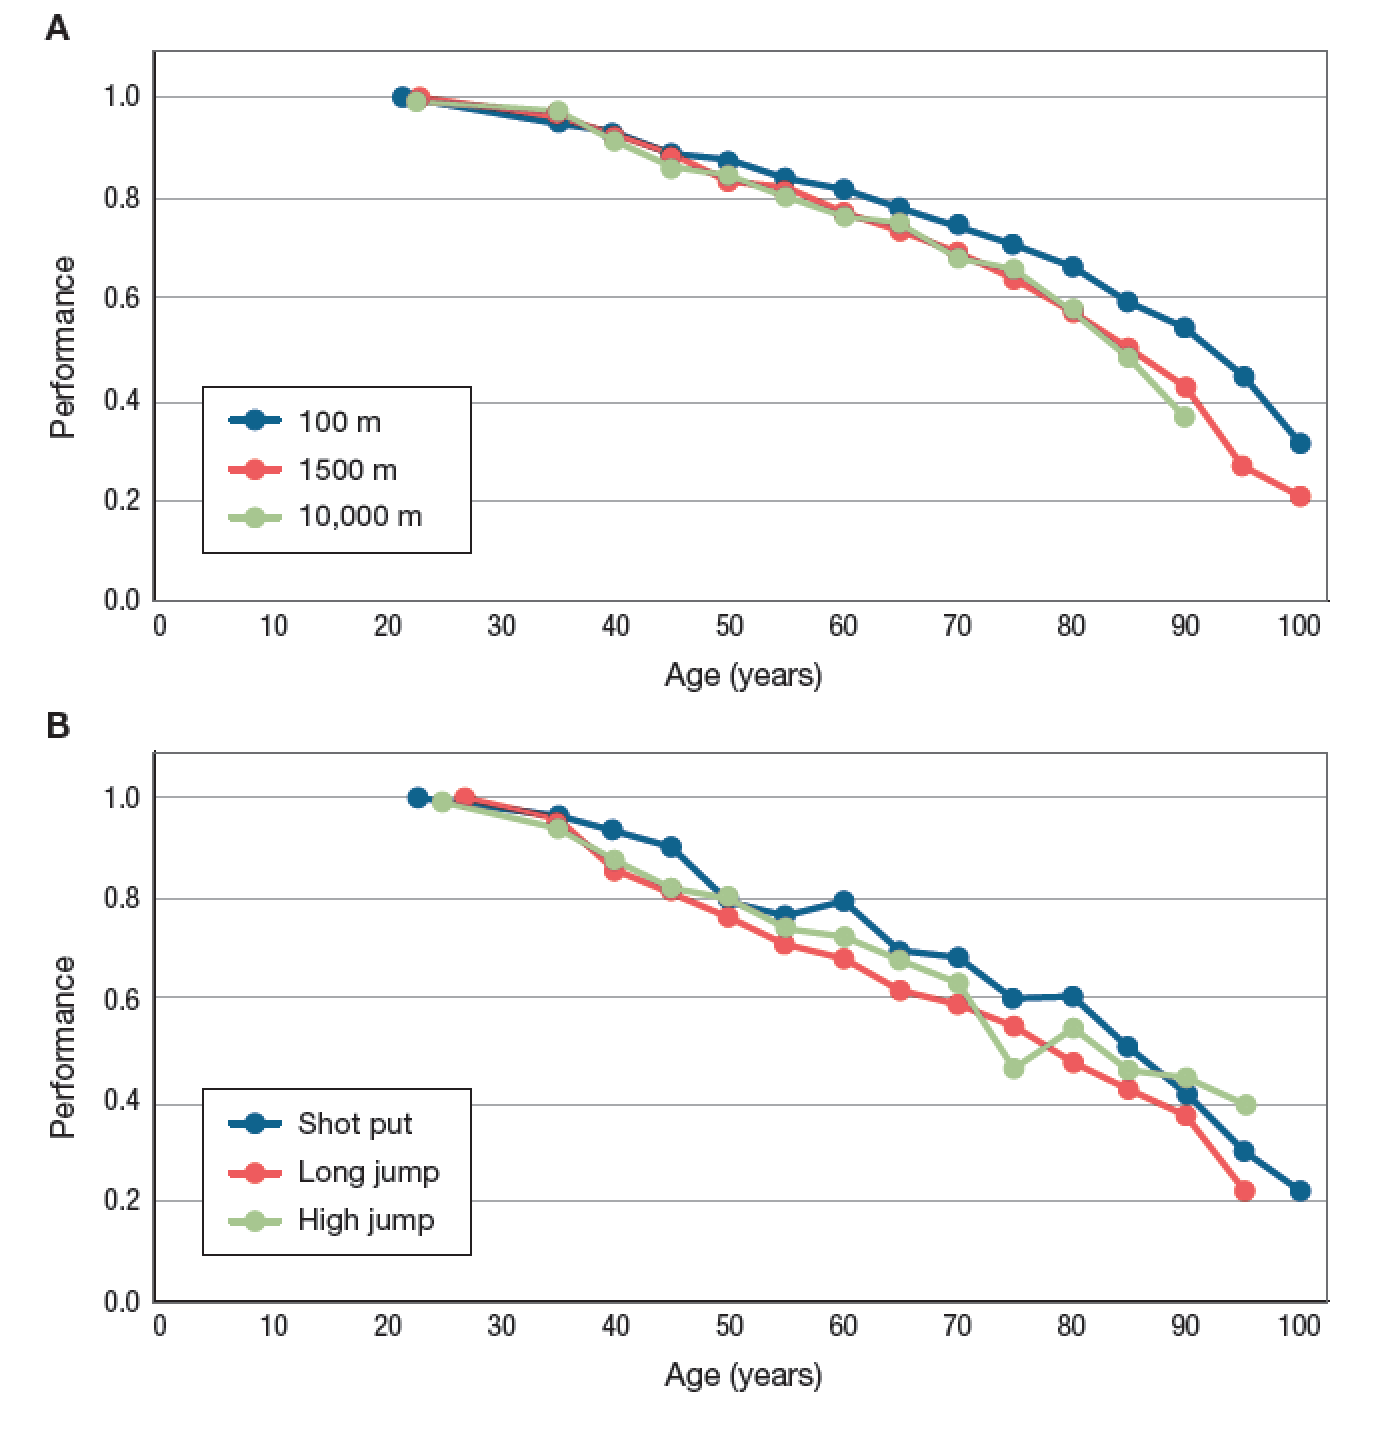
In the advanced undergraduate course that I teach on evolution and medicine, I presented my students with these graphs. I asked them to work in small groups to critique the premise that the curves plotted here are good representations of the physical decline the humans undergo with age. It was, if you will, an exercise in calling bullshit.
I expected that my students would come up the following two objections:
-
The graphs represent the extremes of human performance. They only tell us what happens to the performance of the most elite athletics undergoing rigorous training. The curves illustrated here don't tell us a whole lot about what happens to the physical performance of ordinary humans. It would be unsurprising if majority of us experienced even sharper declines with age, for example.
-
The curves plotted in these graphs do not represent the performance of any single individual. The athletes setting records at age 30 are rarely those who continue to set records in their 50s, 60s, or 70s. This curve, which sketches out the upper limit of human performance as a function of age, may not reflect the performance trajectory of any individual person.
Indeed, class members came up with each of these objections. And to my delight, one student came up with an objection that I hadn't even considered.
"The problem with that graph is that the sample sizes are very different for different ages," one of my students pointed out. "How many 30-year-olds run the 1500 meters competitively? How many 80-year-olds? Far, far fewer. Moreover, these world records are outliers. So from the data provided, we don't really know how much of the decline in performance is due to decreases in sample size, and how much of the decline is due to actual senescence."
It's a brilliant argument, particularly if the distribution of human performance is long-tailed. In principle, the entire decline shown in the figure could occur even if the distribution of performances is the same across all ages but the sample size decreases with increasing age.
To convince ourselves that the argument is plausible, we can simulate this effect, drawing scores from the same distribution but for populations of size 106, 105, etc., down to 101. For each population, we take the highest score (again scaled relative to the highest score overall) and plot it. In the figure below, I've run a simulation using normally distributed, exponentially, and log-normally distributed scores. In all three cases the scores fall off rapidly with decreasing population size. For all three distributions, the top performer in the population of size 10 scores less than 1/3 as high as the top performer overall, despite being drawn from the same distribution. The scores fall off least rapidly in the normal distribution (blue), more quickly in the fat-tailed exponential distribution (yellow) and even faster in the fatter-tailed log-normal distribution (red).
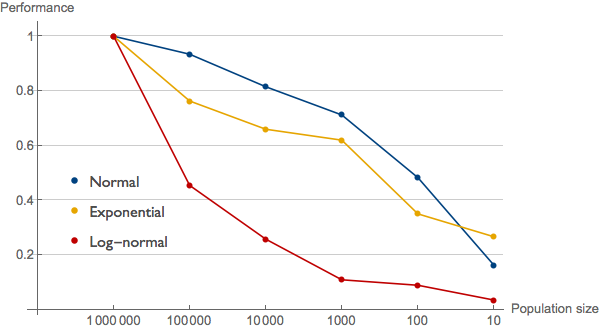
The results of this simulation back my student's arguments with quantitative force. While one could prove the same thing using analytical methods, writing a simulation like this can be a very powerful way of calling bullshit because a reader doesn't need to understand mathematical statistics; she only needs to be able to visually compare the graphs of the real data and the simulated data. In this case, the curves in the simulation look very similar to the plots of the actual world records in the textbook. The burden of proof now lies strongly on the textbook author (i.e, me) to demonstrate that the decline in record times is not merely an artifact of decreasing sample sizes in each age class.
After the initial draft of this piece was posted, my friend and colleague Daniel Weissman wrote me to point out that cohort effects could also be contributing to the decreasing performance trend shown in my original graphs. He is correct. Cohort effects occur when changing environmental conditions over time result in different age groups having experienced different environmental effects on the trait values under observation. In epidemiology, we may observe higher rates of lung cancer in 90-year-olds than in 50-year-olds not only because cancer rates increase with age, but also because of the cohort effect that 50-year-olds are less likely to have smoked in their 20's. For a particularly clear-cut example of cohort effects, consider the plot below. Using rough estimates derived from Lee and Lee's Long Run Education Dataset, we graph mean years of education against current age for Italian citizens.
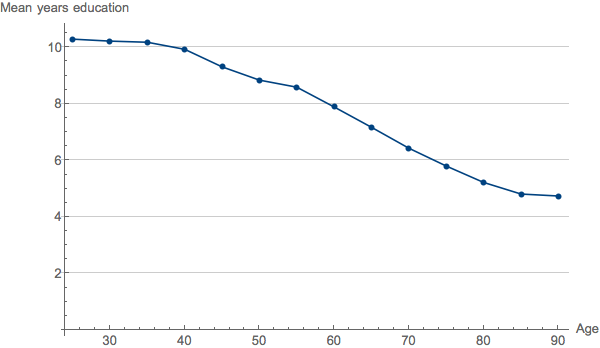
We see a falloff not unlike that observed for track and field records, but no one would think to attribute this to senescence. You can't lose years of education (however easily you may be able to lose what you learned from them). This is a pure cohort effect.
We should expect some cohort effect in track and field records as well. The 80-year-old record holders are not only older than members of other cohorts; they were born earlier and thus differ in a number of ways including training regimens, nutrition, size of the pool able to participate, possible use of performance enhancing drugs, etc.
That said, we expect the magnitude of the cohort effect to be small relative to the magnitude of the decrease in performance. World record 100m times have fallen only 6.5 percent since Jesse Owens ran the 100m in 10.2 seconds at the NCAA Track and Field Championships in 1936.
Author's response
In our Calling Bullshit case studies, we will offer those whose claims we question the opportunity to respond. Here it's a bit silly because I'm both the creator of the original graphs and the caller of bullshit upon them. Still, I wish to add a few words of explanation and, I suppose, self-defense.
When I added this example to the textbook, I was aware of the first two problems listed above. Nonetheless, I wanted a catchy example that would connect to people's interests and experiences. Track and field records seemed to serve very well in that capacity. By looking at world record times, I also intended to stress the inevitability of decline with age: if it happens to the very best athletes in the world, of course it'll happen to you and me. Finally, to avoid misleading anyone, I noted the first issue in the figure caption. In the forthcoming third edition of the textbook, I'll probably also add a within-chapter study question around the issue treated here.
I agree that if these data were our best proof of declining physical performance with age, the sample size argument would be a serious problem. I would have to go back to the original data, tabulate the distribution of performances at each age, and demonstrate statistically that those performance scores could not be drawn from a single distribution that applies to all ages. I'm not too worried, however. In favor of the initial claim we have both a wealth of practical experience (at my age, playing soccer against 20-year-olds is beyond brutal), and literally thousands of medical research studies that quantify exactly how aging leads to declines in any number of aspects of physical performance. So I don't think the basic fact of human senescence is at risk. But it sure is fun to see how a seemingly slam-dunk set of data can be ripped apart by a sufficiently clever student.